Culture is your invisible asset.
It decides who stays, who leaves and who performs, yet it never shows up on a balance sheet. Ask finance for churn and you get a number in seconds. Ask for culture and the room goes quiet. Priority Bridge gives culture what every other asset already has: one definition, one fixed set of dimensions, one measure.
Want your own profile? Get it free
Turnover is the bill for culture
you can't see.
Culture is the part nobody standardized.
Culture: shared values and beliefs that interact with a company's people and systems toward a common goal (Uttal, 1983; Schein, 1990).
The one thing a competitor cannot copy is also the one thing with no shared definition, no standard measure and no agreed link to your numbers.
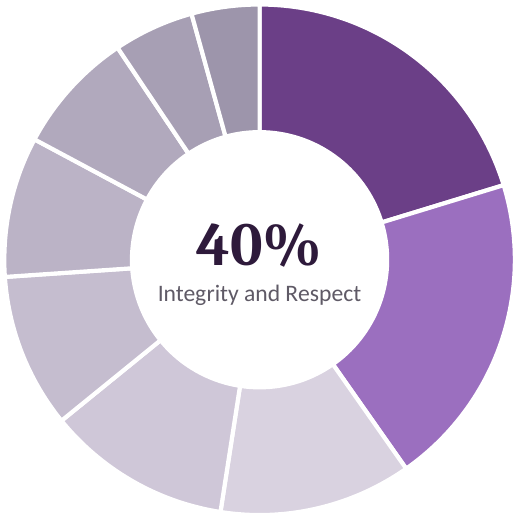
Every other asset has a standard. Revenue has GAAP and credit has a score, but culture had none, so it could never be compared, tracked or tied to results. One definition, one set of values and one measure change that: any team compares with any other, and culture finally connects to the numbers.
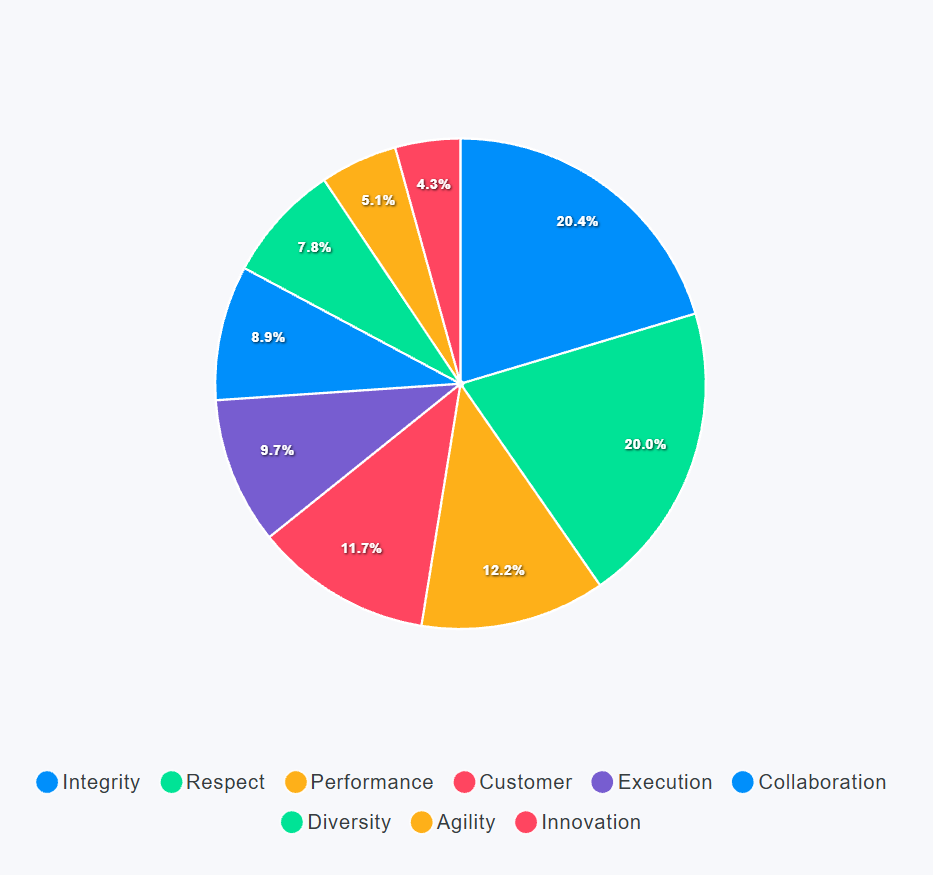
The Big Nine Cultural Dimensions.
Every company has all nine. The order is what makes each one different, and the order is what makes you different too.
Two steps. Ten minutes each.
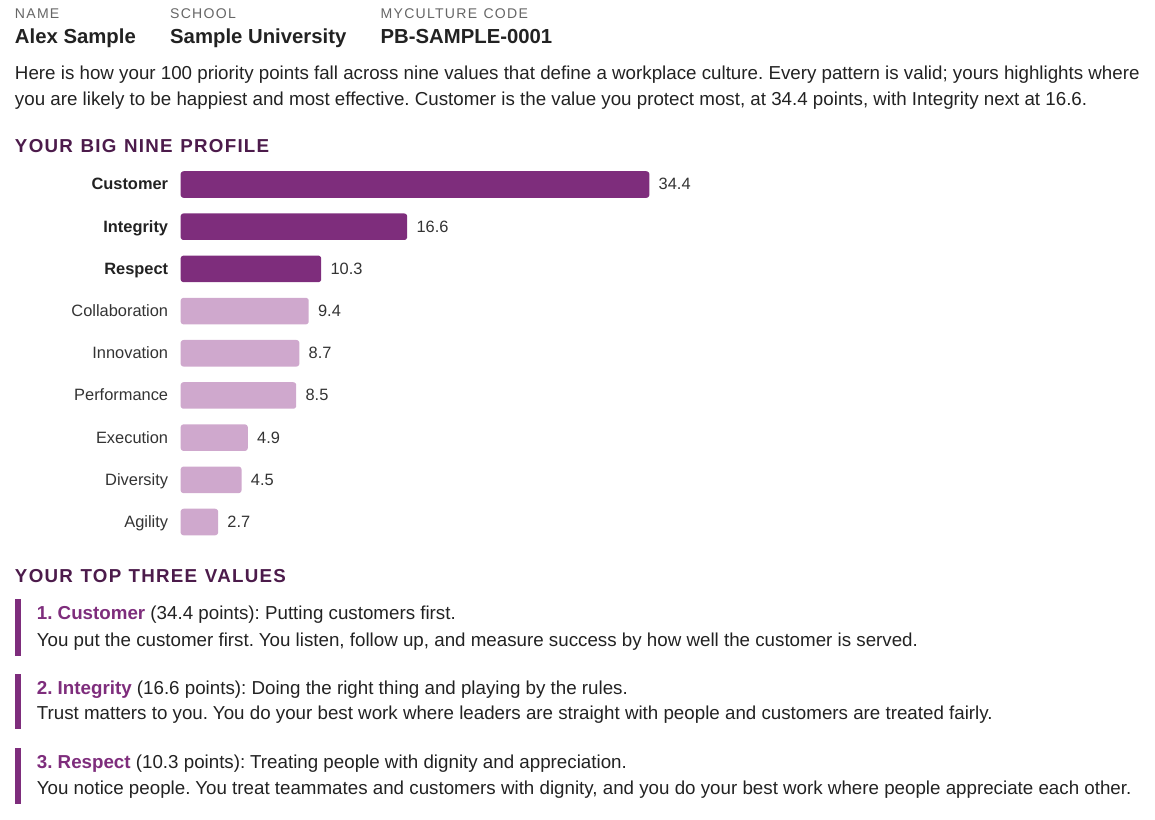
Every employee. 100 points. Nine values.
A culture profile for the company, every location, every department and every team.
Every candidate. Same profile. Shared by code.
See where they fit, where else they would thrive, and what to ask in the interview.
Every team builds its own culture.
People join a team, not a company average. See every location and department, side by side.
| Department | 1st priority | 2nd priority | 3rd priority |
|---|---|---|---|
| Location 17 departments | |||
| Sales | Integrity20.1 | Respect19.7 | Customer17.9 |
| Service | Integrity22.2 | Respect19.5 | Performance13.8 |
| Supply | Respect22.0 | Integrity20.7 | Collaboration10.1 |
| Operations | Respect26.4 | Integrity15.5 | Performance14.2 |
| Finance | Integrity20.4 | Customer19.0 | Respect18.7 |
| Customer Support | Respect12.8 | Diversity12.8 | Collaboration12.8 |
| Admin and Leadership | Integrity26.4 | Respect22.7 | Customer17.1 |
| Location 26 departments | |||
| Sales | Respect25.2 | Integrity18.0 | Performance16.3 |
| Service | Integrity16.0 | Respect16.0 | Customer14.4 |
| Supply | Respect24.3 | Integrity22.4 | Execution12.2 |
| Operations | Respect20.3 | Integrity19.4 | Execution10.8 |
| Customer Support | Respect21.1 | Integrity15.4 | Customer12.2 |
| Admin and Leadership | Integrity28.2 | Respect16.1 | Performance11.5 |
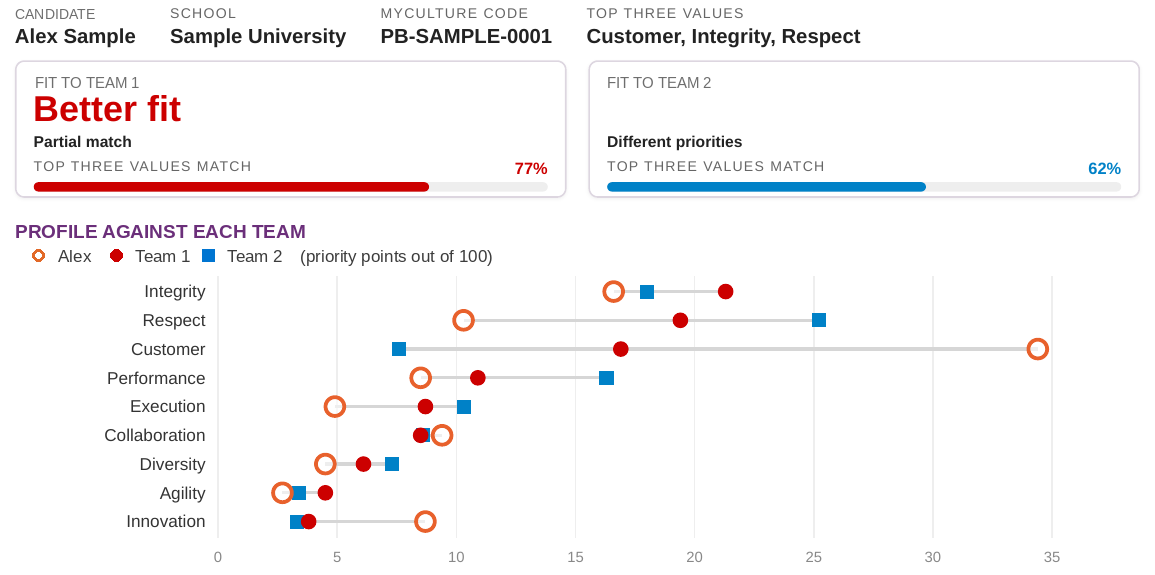
Every candidate, matched.
Fit to the exact team. Where else they would thrive. Two questions for the interview. It never disqualifies anyone.
“Priority Bridge has helped us better understand our people and the culture we’re building at Stevenson-Hendrick Honda and Mazda. We’ve started using the candidate fit reports to bring another perspective to our hiring conversations. The value has been in creating more thoughtful conversations about people, their strengths, and how they can succeed.”
Know what you value. Then show it.
100 points across nine values, in about ten minutes. Put your code on your resume and your LinkedIn banner. Any recruiter can scan it.
Free for individuals, always. Not a test. It never screens anyone out.
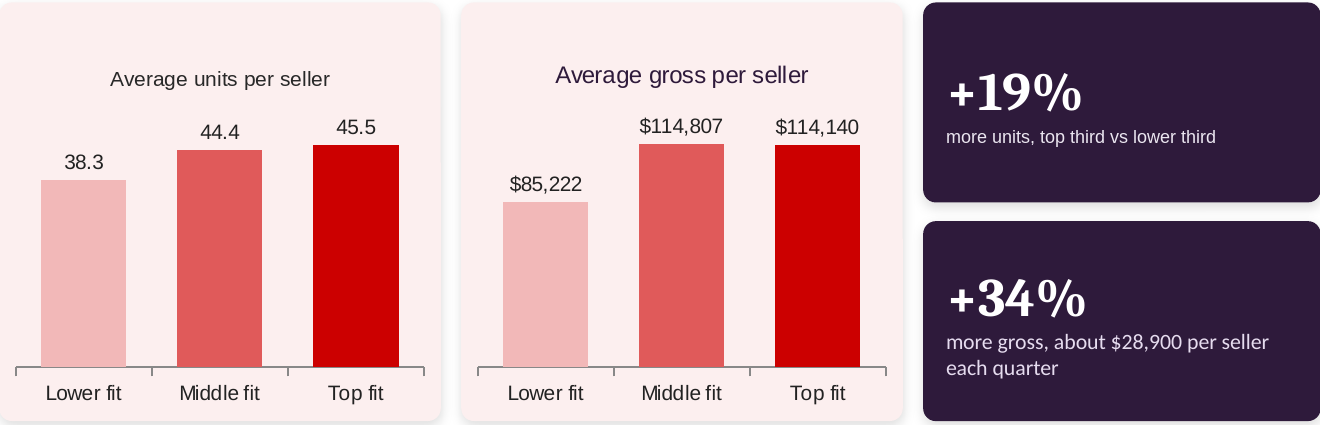
When people fit, the numbers move.
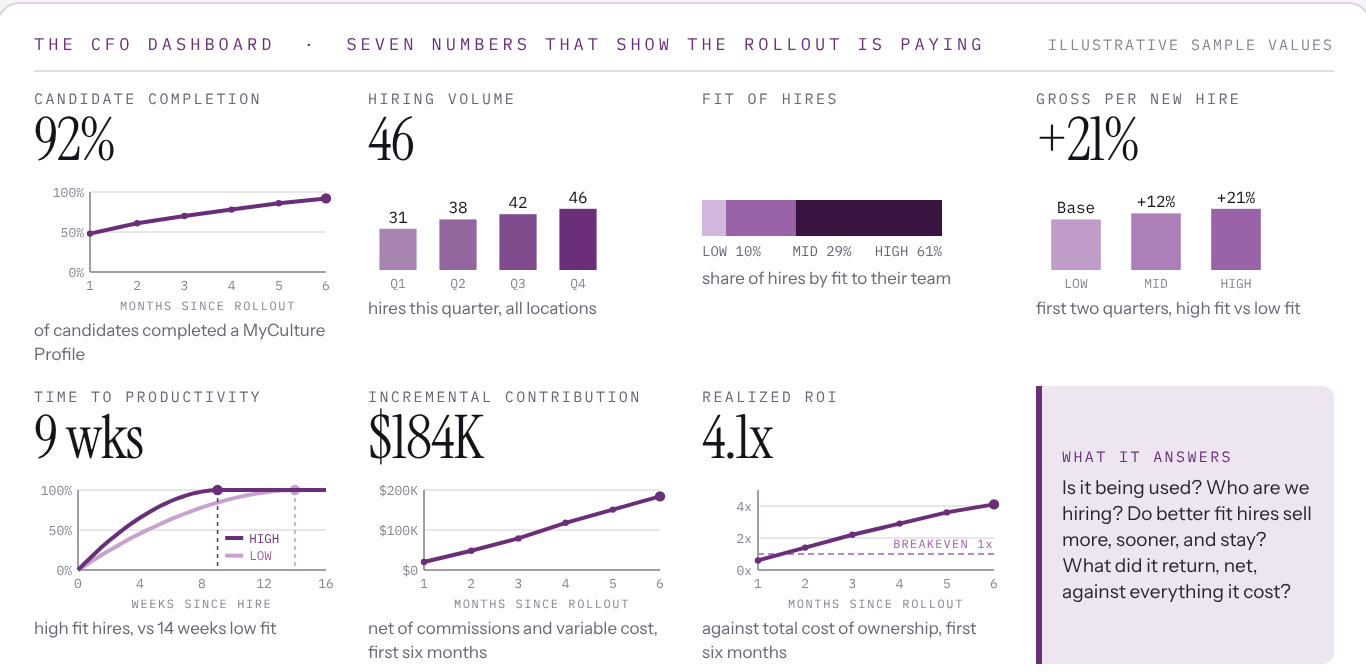
What fit is worth, in your numbers.
One dashboard your finance team can read in a minute. Net, not gross. Total cost. Your baseline.
What is turnover costing you?
Turnover rates: BLS JOLTS, 2025 annual average total separations by industry, shown here on a yearly basis. Pay: BLS average weekly earnings by industry, September 2026, times 52. Cost of turnover: 1.25 times pay, a conservative estimate. Full payback on a call.

Let's measure yours.
A 15 minute call. We will show you what fit is worth in your numbers.
Want your own profile? Get it free